Do you know how much money you make on each sale?
TL;DR
- Contribution margin = revenue minus all variable costs per order — it shows true per-order profitability after ad spend, shipping, and payment fees.
- A 55% gross margin product can still lose money per sale once CAC and fulfillment are counted — contribution margin reveals this gap gross margin hides.
- Healthy contribution margin for DTC eCommerce is typically 25–40%. Below 20% signals a structural margin problem requiring immediate action.
- Use CM to set your maximum CAC by channel, identify low-margin SKUs to cut, and decide which channels are actually profitable to scale.
What is contribution margin in eCommerce?
Contribution margin is the revenue remaining after subtracting all variable costs associated with a sale — including COGS, shipping, fulfillment, customer acquisition cost (CAC), and payment processing fees. Unlike gross margin, it accounts for the real cost of acquiring and delivering each order, making it the most accurate measure of per-unit profitability for DTC brands.
How do you calculate contribution margin for a DTC brand?
Contribution margin per order = Revenue − (COGS + Shipping + Fulfillment + CAC + Payment Fees + Returns allocation). As a percentage: divide the result by revenue and multiply by 100. A $100 order with $35 COGS, $12 shipping, $18 CAC, and $3 payment fees has a $32 contribution margin, or 32%.
What's a healthy contribution margin for eCommerce?
Most profitable DTC brands target a contribution margin of 25–40% on a fully-loaded per-order basis. Brands below 20% are typically not generating enough per-order profit to cover fixed costs at meaningful revenue levels. Above 40% usually indicates strong unit economics, pricing power, or very efficient acquisition — and signals room to invest more aggressively in growth.
We're not talking about revenue or gross profit. The real number. After product cost, shipping, ad spend, and payment processing fees are all subtracted.
If you don't know it, you're flying blind. And "flying blind" in eCommerce usually means you're scaling a leaky business.
For example, a product with a 55% gross margin can still be losing money on each sale once you account for the actual cost of acquiring a customer and getting an order out the door. Contribution margin is the metric that solves that.
This article breaks down exactly what contribution margin is.
What Is Contribution Margin?
Contribution margin is the revenue remaining after subtracting all variable costs associated with a sale. It tells you how much each order actually contributes toward covering your fixed costs — things like rent, software subscriptions, and salaries — and eventually generating real profit.
For eCommerce, variable costs typically include:
- Cost of Goods Sold (COGS): Raw materials, manufacturing, inbound freight, packaging
- Shipping & Fulfillment: Carrier fees, pick-and-pack labor, 3PL charges, packaging materials
- Customer Acquisition Cost (CAC): Total ad spend divided by total orders. Often the largest variable cost for DTC brands.
- Payment Processing: Shopify Payments charges 2.9% + $0.30 per transaction. Stripe and PayPal run similar rates.
- Returns & Refunds: Your average return rate applied across orders
Add those up and subtract from your selling price. What's left is your contribution margin per unit.
Contribution Margin Formula
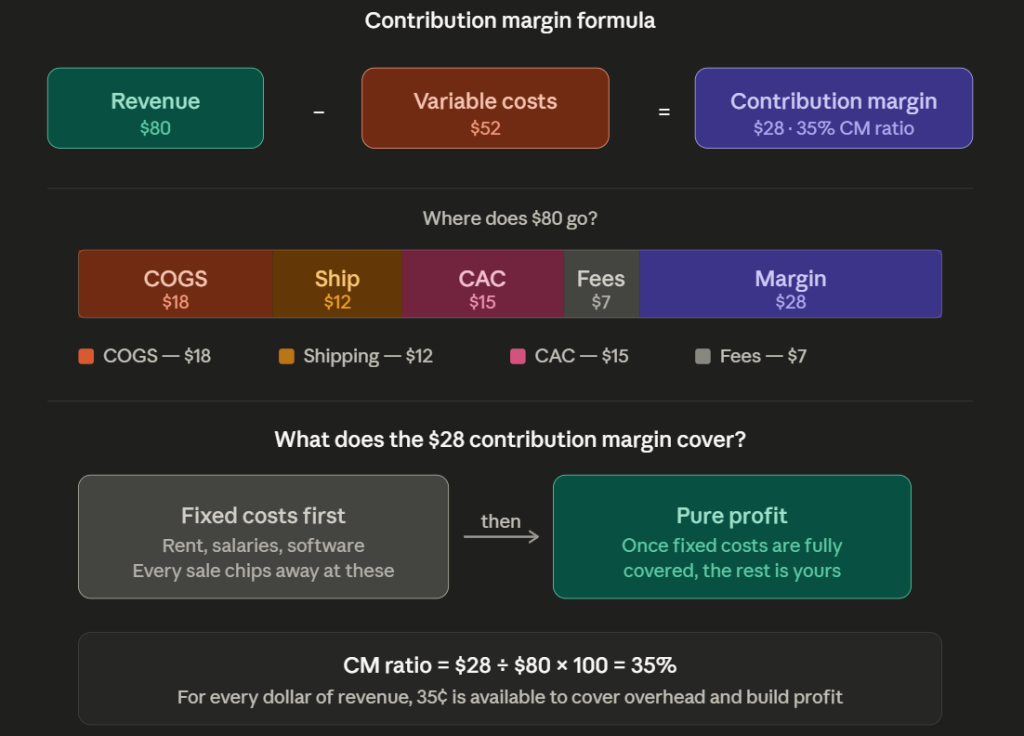
Contribution Margin = Revenue − Variable Costs
CM Ratio = Contribution Margin ÷ Revenue × 100
If you sell a product for $80 and your total variable costs (COGS, shipping, CAC, fees) come to $52, your contribution margin is $28, or a 35% CM ratio. That $28 is what every sale puts toward covering your fixed overhead. Once fixed costs are covered, it becomes profit.
Contribution Margin vs. Gross Margin: Know the Difference
This is where a lot of eCommerce brands get into serious trouble. Gross margin and contribution margin sound similar. They're not.
- Gross margin subtracts only COGS from revenue. Most Shopify dashboards, Amazon Seller Central reports, and P&L templates default to this number.
- Contribution margin subtracts COGS plus all other variable costs — shipping, fulfillment, ad spend, processing fees.
A product with a 58% gross margin can easily have a negative contribution margin if your CAC is high and shipping is expensive. That product isn't a winner.
From our perspective at TGM: the brands that run into profitability walls at scale are almost always the ones that were optimizing to gross margin while ignoring contribution margin. Gross margin tells you what you made before the real costs hit. Contribution margin tells you what you actually have left.
💡 TIP: If your platform or accountant is only showing you gross margin, ask for a contribution margin breakdown by SKU. You'll often find that your top-selling products aren't your most profitable ones.
How to Calculate Your Break-Even Point Using CM
Once you know your contribution margin per unit, your break-even calculation becomes straightforward.
Break-Even Units = Fixed Monthly Costs ÷ Contribution Margin Per Unit
Example: If your CM per unit is $26 and your monthly fixed costs (rent, team, software, etc.) total $15,000 — you need to sell 577 units per month just to break even. Not to profit. Just to stop losing money.
That number changes everything about how you think about ad spend, inventory, and minimum viable order volume.
| Fixed Costs | CM Per Unit | Break-Even Units |
|---|---|---|
| $5,000 | $26 | 193 units |
| $10,000 | $26 | 385 units |
| $15,000 | $26 | 577 units |
| $25,000 | $26 | 962 units |
Run this calculation before you increase ad spend. If your contribution margin per unit drops because CAC goes up, your break-even point climbs fast.
💸 Run your numbers: Use TGM's free Contribution Margin Calculator to calculate your per-unit CM, CM ratio, and exact break-even point — built specifically for eCommerce, with fields for COGS, shipping, ad spend, and processing fees.
Why Contribution Margin Is the Most Important Metric for DTC Brands
For DTC brands running paid ads, contribution margin is the most actionable metric you have. Here's why.
- It directly connects ad spend to profitability. When you increase your CAC by $5, your contribution margin drops by $5. That trade-off is invisible in gross margin. It's immediate in CM.
- It tells you whether scaling will work. A business with a healthy CM ratio can scale ad spend and expect margin to hold or improve. A business with a thin or negative CM will only bleed faster at scale.
- It drives smarter pricing decisions. If you're looking at a new product with a 40% gross margin but a 12% CM ratio once you factor in CAC and shipping, you know upfront that the pricing or cost structure needs to change before you can profitably grow it.
- It's what TGM actually optimizes. When we work with DTC brands, we don't just chase ROAS. We measure every engagement against contribution margin and Marketing Efficiency Ratio (MER) — the metrics that actually reflect P&L reality, not platform-reported numbers.
💡 TIP: Calculate CM by SKU and by acquisition channel. You'll often find that some channels deliver customers at a profitable CM while others are underwater. Even if blended ROAS looks fine.
What's a Healthy Contribution Margin for eCommerce?
There's no universal number, but here are the benchmarks we use across our client portfolio:
| CM Ratio | What It Means |
|---|---|
| Below 10% | Danger zone. Fixed costs will likely make this business unprofitable. |
| 10–20% | Thin. Viable at scale with lean overhead, but fragile. |
| 20–35% | Healthy range for most DTC brands running paid acquisition. |
| 35–50% | Strong. Room to invest aggressively in growth. |
| 50%+ | Exceptional. Usually seen in high-margin categories (beauty, supplements, digital) or subscription models. |
Subscription brands consistently hit the highest CM ratios because retention compounds margin over time — each repeat purchase carries no additional CAC. That's why subscription cohorts often generate 2–3x the LTV of one-time buyers at near-zero marginal ad cost.
Three Levers to Improve Contribution Margin
If your CM is thin, you have three levers to pull:
1. Reduce variable costs. Renegotiate COGS with your supplier, optimize fulfillment (3PL contracts, packaging weight), and reduce your payment processing fees where possible. Every dollar saved here goes directly to CM.
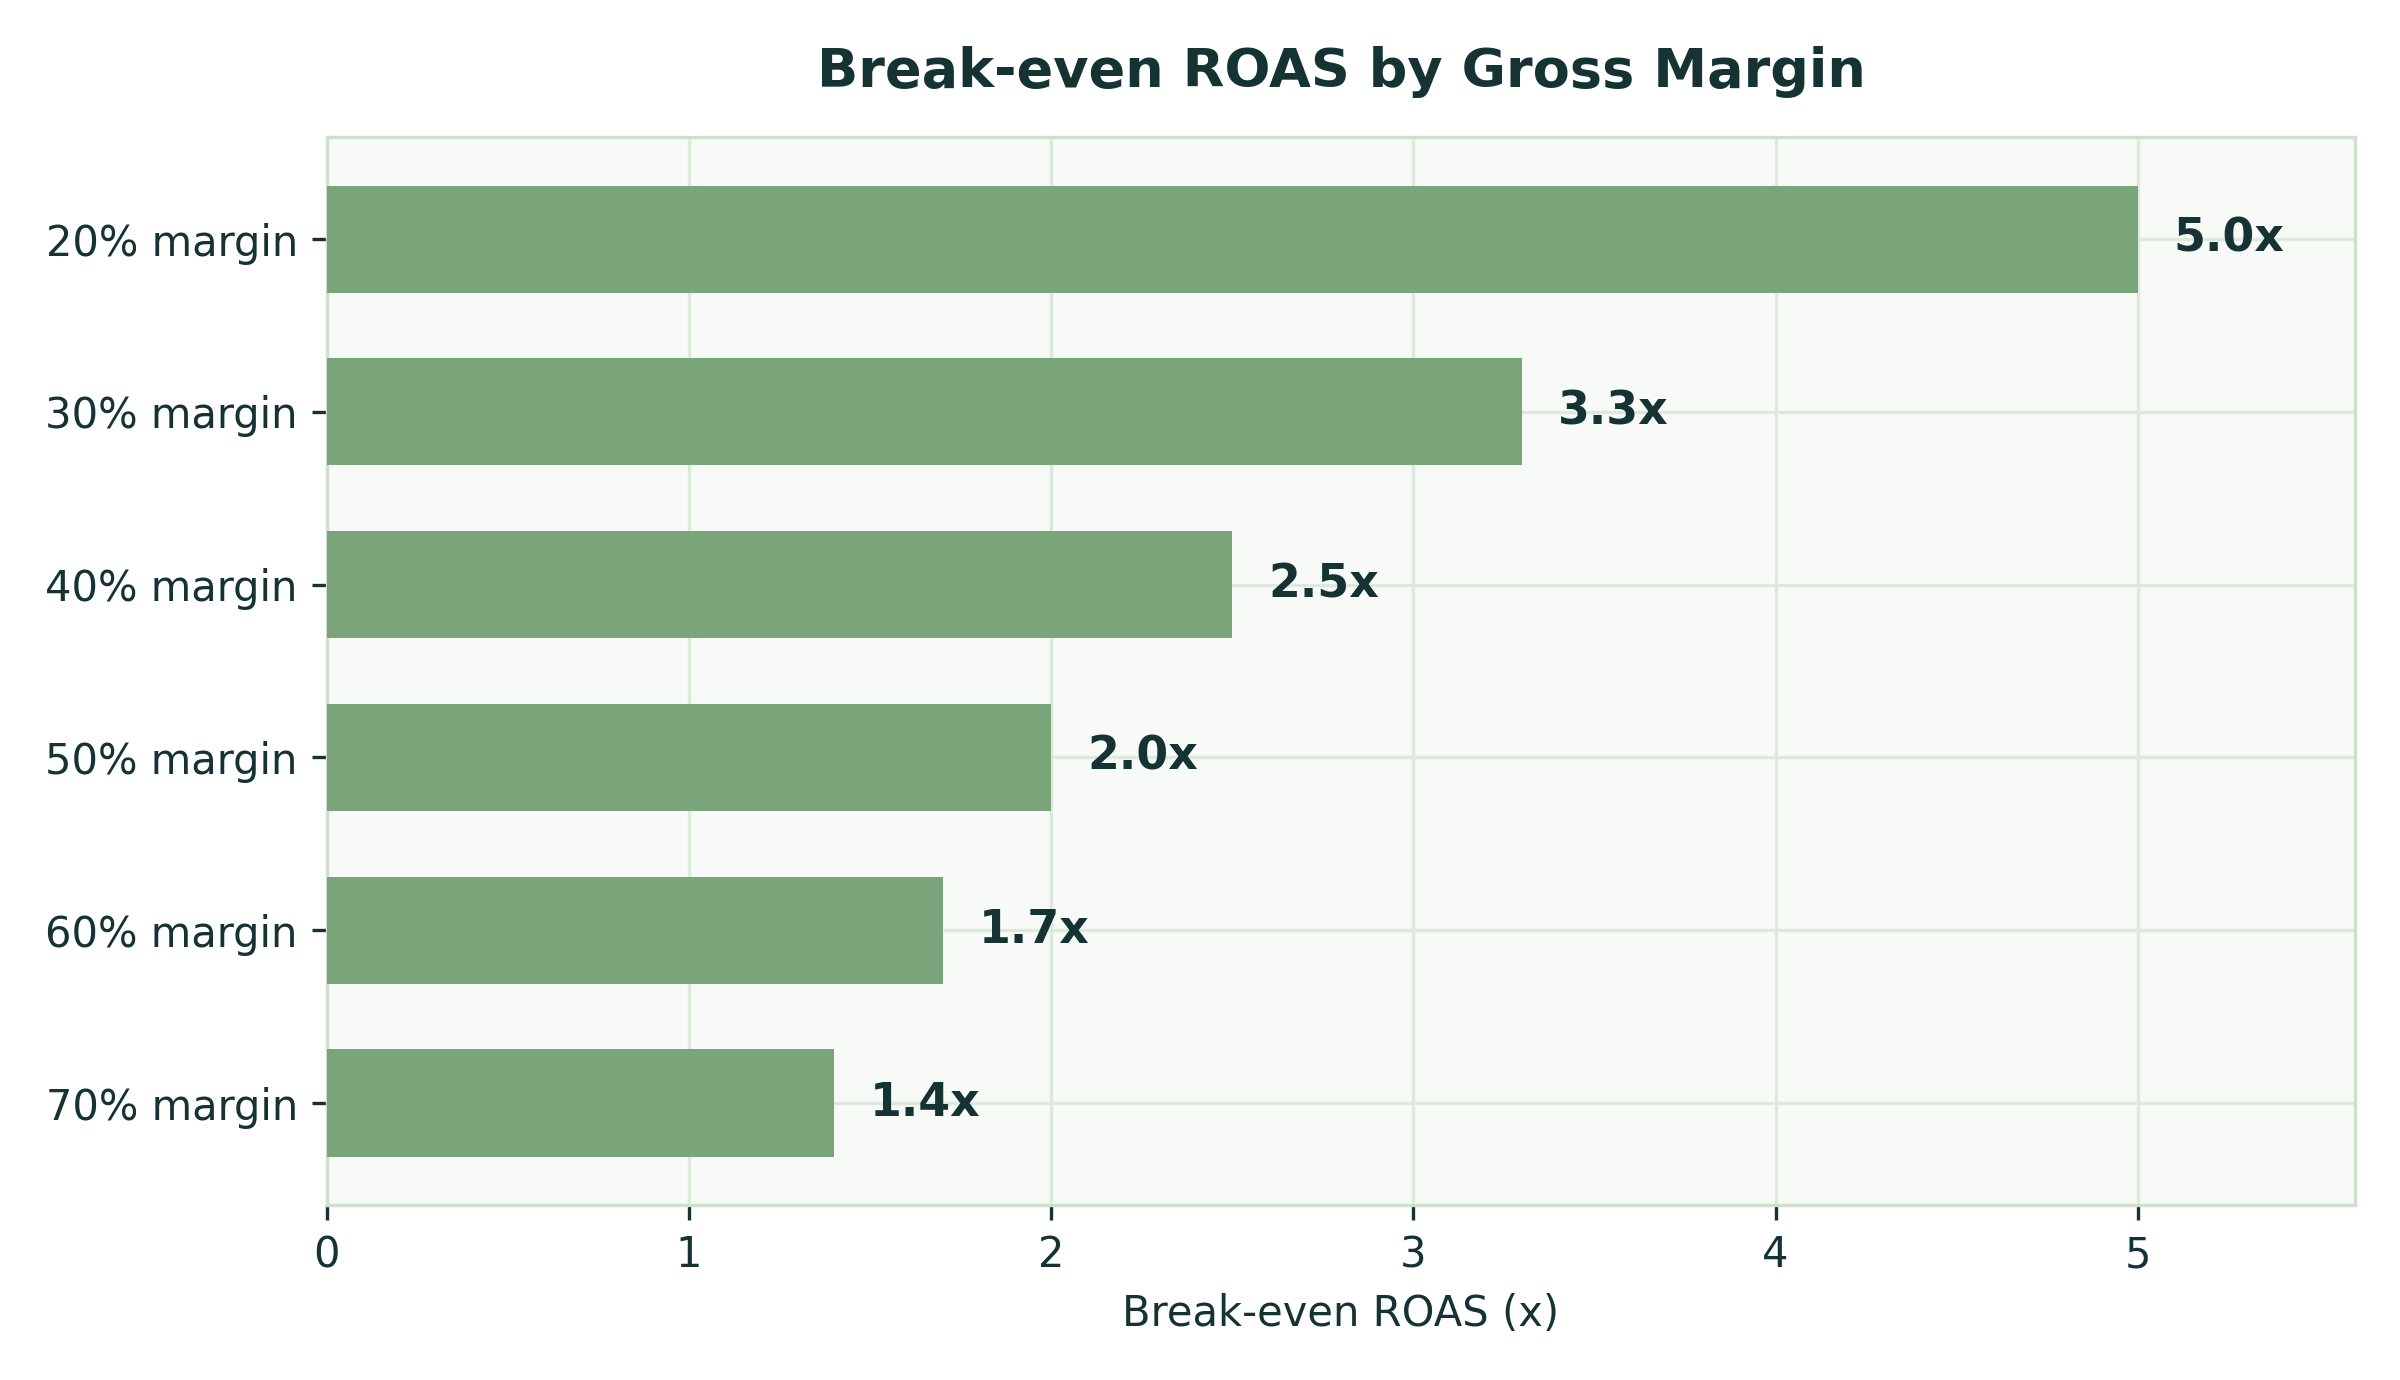
2. Lower your CAC. Better creative, tighter audience targeting, and stronger landing pages all reduce the cost to acquire a customer. Our DTC Unit Economics Guide covers this in full — including the break-even ROAS formula that ties CAC directly to margin.
3. Increase AOV. Bundles, upsells, and minimum order thresholds for free shipping all lift average order value without changing your fixed cost base. A +15% AOV improvement on the same CAC can meaningfully shift your CM ratio.
The fastest path to margin improvement is usually a combination of all three — not a dramatic swing on one.
Don't Complicate. Contribute
Contribution margin isn't a complicated concept. But it's one that most eCommerce brands ignore in favor of metrics that feel good but don't tell the full story. Gross margin looks healthy. ROAS looks strong. And yet the business isn't generating real profit.
Contribution margin closes that gap. It forces you to account for every variable cost before declaring a product, a channel, or a campaign profitable. Once you know your CM per unit and your CM ratio, you have a foundation for every growth decision: pricing, ad spend, SKU prioritization, and scaling readiness.
Frequently Asked Questions
What is contribution margin and how is it different from gross margin?
Gross margin only subtracts the cost of goods sold (COGS) from revenue — it ignores ad spend, shipping, fulfillment, and payment processing. Contribution margin subtracts all variable costs, including your customer acquisition cost. For DTC brands, contribution margin is the more accurate measure of profitability because it captures the true economic cost of each order including what you spent to acquire that customer.
How do I calculate contribution margin per order for my eCommerce store?
Use this formula: Contribution Margin = Revenue − COGS − Shipping − Fulfillment − CAC − Payment Processing Fees − Returns Allocation. To get contribution margin percentage, divide the result by revenue and multiply by 100. Pull your average CAC from your ad account (total ad spend ÷ total orders), your average shipping cost from Shopify or your 3PL, and COGS from your accounting system.
What's a healthy contribution margin for a DTC eCommerce brand?
The generally accepted benchmark is 25–40% contribution margin on a fully-loaded basis. Brands below 20% are often unable to cover fixed costs (rent, salaries, software) at achievable revenue levels, meaning they're structurally unprofitable. Brands above 40% have strong unit economics and pricing power — they can invest more aggressively in acquisition without risking profitability.
How does customer acquisition cost affect contribution margin?
CAC is often the largest variable cost for DTC brands, and it flows directly into your contribution margin calculation. If your Meta CPMs rise 30% and your CAC increases from $25 to $32 on a $90 AOV product, your contribution margin drops by 7 percentage points — potentially moving from profitable to breakeven or below. This is why knowing your break-even CAC (the maximum you can spend and still hit your CM target) is essential before scaling.
Can contribution margin help me decide which products or channels to cut or scale?
Absolutely — it's the primary tool for those decisions. Calculate contribution margin by SKU to identify products that look healthy on gross margin but lose money after fulfillment and acquisition costs. Do the same by channel: if Meta campaigns consistently deliver 18% CM while Google delivers 35%, allocate budget accordingly. Cutting low-CM SKUs or channels and doubling down on high-CM ones is one of the fastest paths to profitability improvement.
Know this number. Build every growth decision around it.
If you want help auditing your contribution margin and building a channel strategy that actually supports profitable scaling, that's exactly what we do. Book a free strategy call →


0 Comments