
TL;DR
- Meta earned $59.36 billion from advertising in Q2 2026, up 27% year over year.
- 3.60 billion people used a Meta app daily in June 2026, and 71% of US adults use Facebook.
- Ad impressions rose 14% and average price per ad rose 12% in Q2 2026.
- Across 15 DTC accounts, median Facebook CPM was $13.52, CPC $0.57 and CTR 2.68%.
What are the most important Facebook ad statistics for 2026?
Meta's advertising revenue reached $59.36 billion in Q2 2026, up 27% year over year. Ad impressions grew 14% and the average price per ad grew 12%. Meta reported 3.60 billion daily active people across its apps in June 2026.
How much do Facebook ads cost in 2026?
The median Facebook ads CPM is $13.52 across 15 DTC accounts that Top Growth Marketing tracked from July 2025 to June 2026. The median cost per click in that panel is $0.57, and the middle half of accounts paid between $11.04 and $22.90 per 1,000 impressions.
Is Facebook advertising still growing?
Yes. Meta's advertising revenue grew 22% in 2025 to $196.18 billion, then grew 33% in Q1 2026 and 27% in Q2 2026. Growth came from both sides of the auction: more ad impressions delivered and a higher average price per ad.
Facebook ad statistics go stale fast. Many roundups still quote user counts and CPMs from 2021, which is no help when you're setting a budget for next quarter.
This page uses four sources, each re-checked in October 2026: Meta's earnings releases, Pew Research Center, WordStream's industry benchmarks, and our own Meta ads benchmarks from 15 DTC ad accounts. Every stat names where it came from and when.
We run Meta ads for DTC brands every day, so the cost numbers further down come from accounts we manage. The platform numbers come straight from Meta.
Facebook Audience Statistics
1. 3.60 billion people use a Meta app every day
Meta reported 3.60 billion daily active people across Facebook, Instagram, WhatsApp and Messenger in June 2026, up 3% year over year, according to its Q2 2026 earnings release.
2. Meta's daily audience grew by 60 million people in nine months
Daily active people averaged 3.54 billion in September 2025, 3.58 billion in December 2025, 3.56 billion in March 2026 and 3.60 billion in June 2026. Meta's releases give no Facebook-only user count, so any 2026 figure you see for Facebook alone is an outside estimate.
3. 71% of US adults use Facebook
That's from Pew Research Center, which surveyed US adults between February and June 2025. Only YouTube reaches more American adults, at 84%.
4. Half of US adults use Instagram
The same Pew survey puts Instagram at 50% of US adults, TikTok at 37% and WhatsApp at 32%. One Meta ad account reaches both Facebook and Instagram.
Facebook Ad Revenue Statistics
5. Meta earned $59.36 billion from ads in Q2 2026
Advertising revenue was $59.36 billion for the quarter ended June 30, 2026. That's 27% more than the same quarter a year earlier.
6. Ads are 97.6% of Meta's revenue
Total revenue for the quarter was $60.80 billion, so advertising accounted for 97.6 cents of every dollar. Reality Labs brought in $431 million.
7. Meta's 2025 ad revenue was $196.18 billion
Full-year advertising revenue rose 22% from $160.63 billion in 2024, per Meta's fourth quarter and full year 2025 results.
8. Q1 2026 ad revenue grew 33%
Advertising revenue reached $55.02 billion in the first quarter of 2026, up from $41.39 billion a year earlier. That was the fastest growth of the last four quarters.
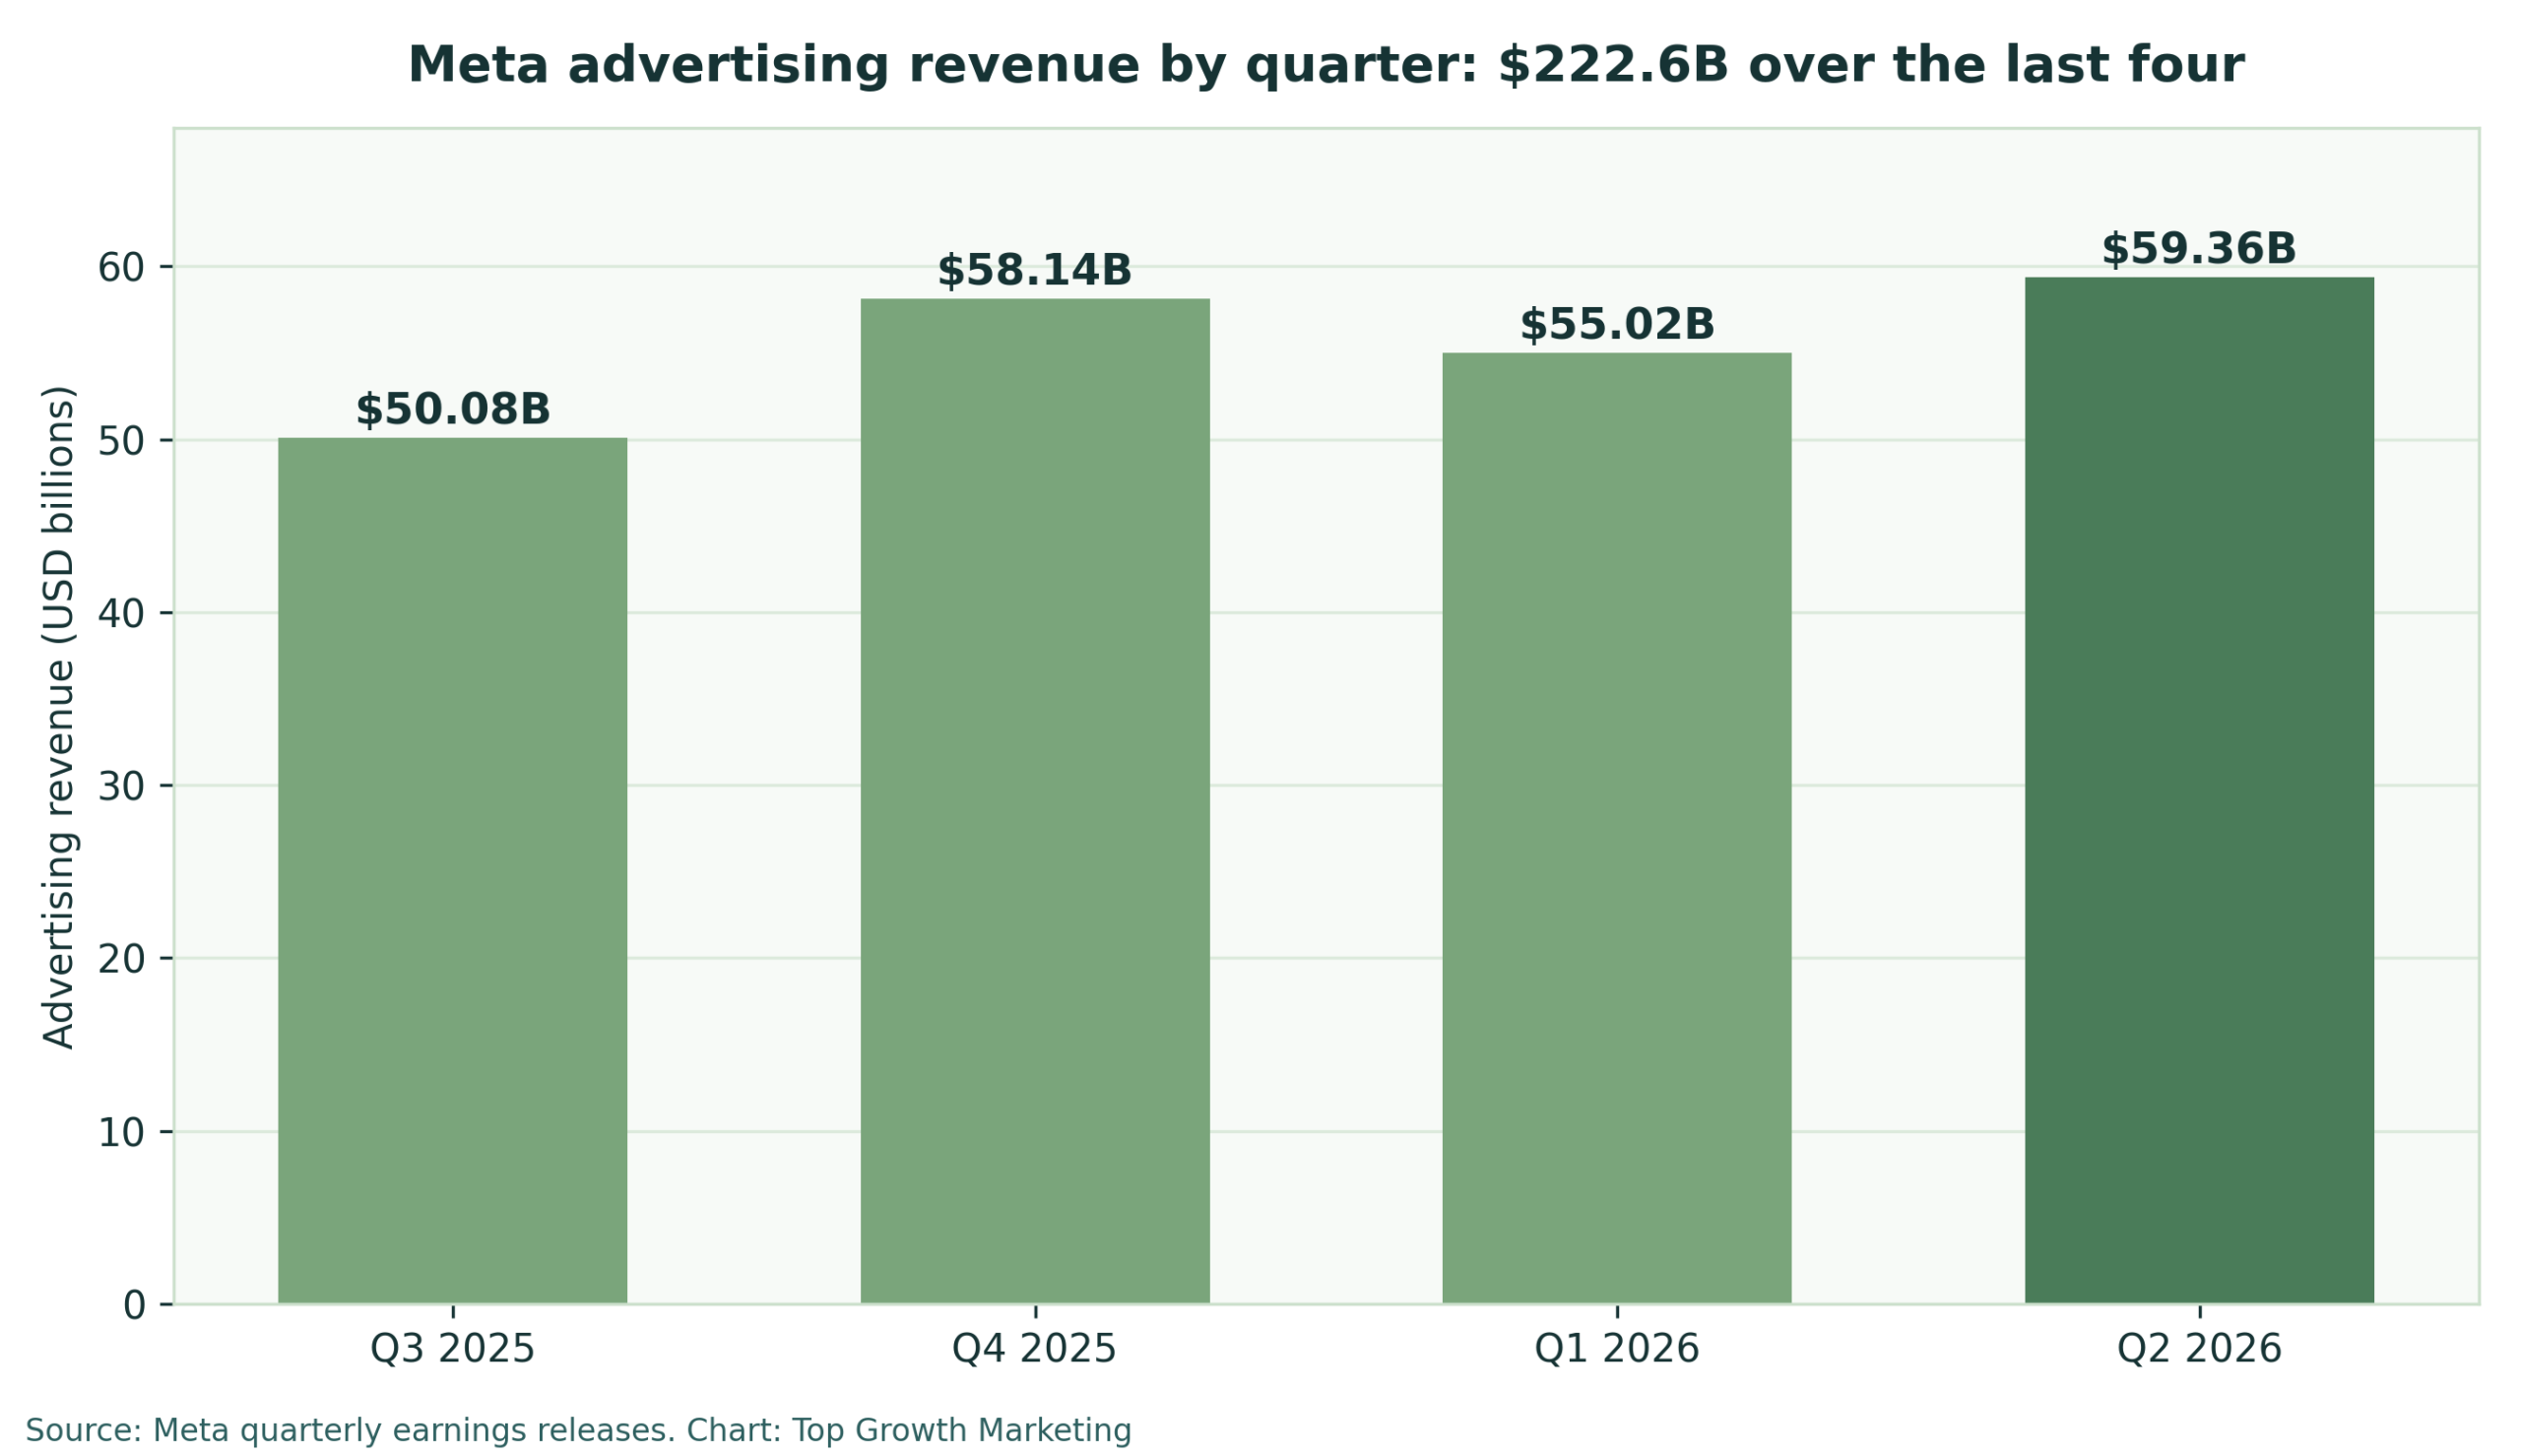
9. Meta has taken in $222.6 billion from ads in the last four quarters
Add Q3 2025 ($50.08 billion), Q4 2025 ($58.14 billion), Q1 2026 ($55.02 billion) and Q2 2026 ($59.36 billion) and you get $222.6 billion. The sum is ours. The four inputs are Meta's.
Facebook Ad Supply and Pricing Statistics
10. Ad impressions grew 14% in Q2 2026
"Ad impressions delivered across our Family of Apps increased by 14% year-over-year." — Meta, Q2 2026 results
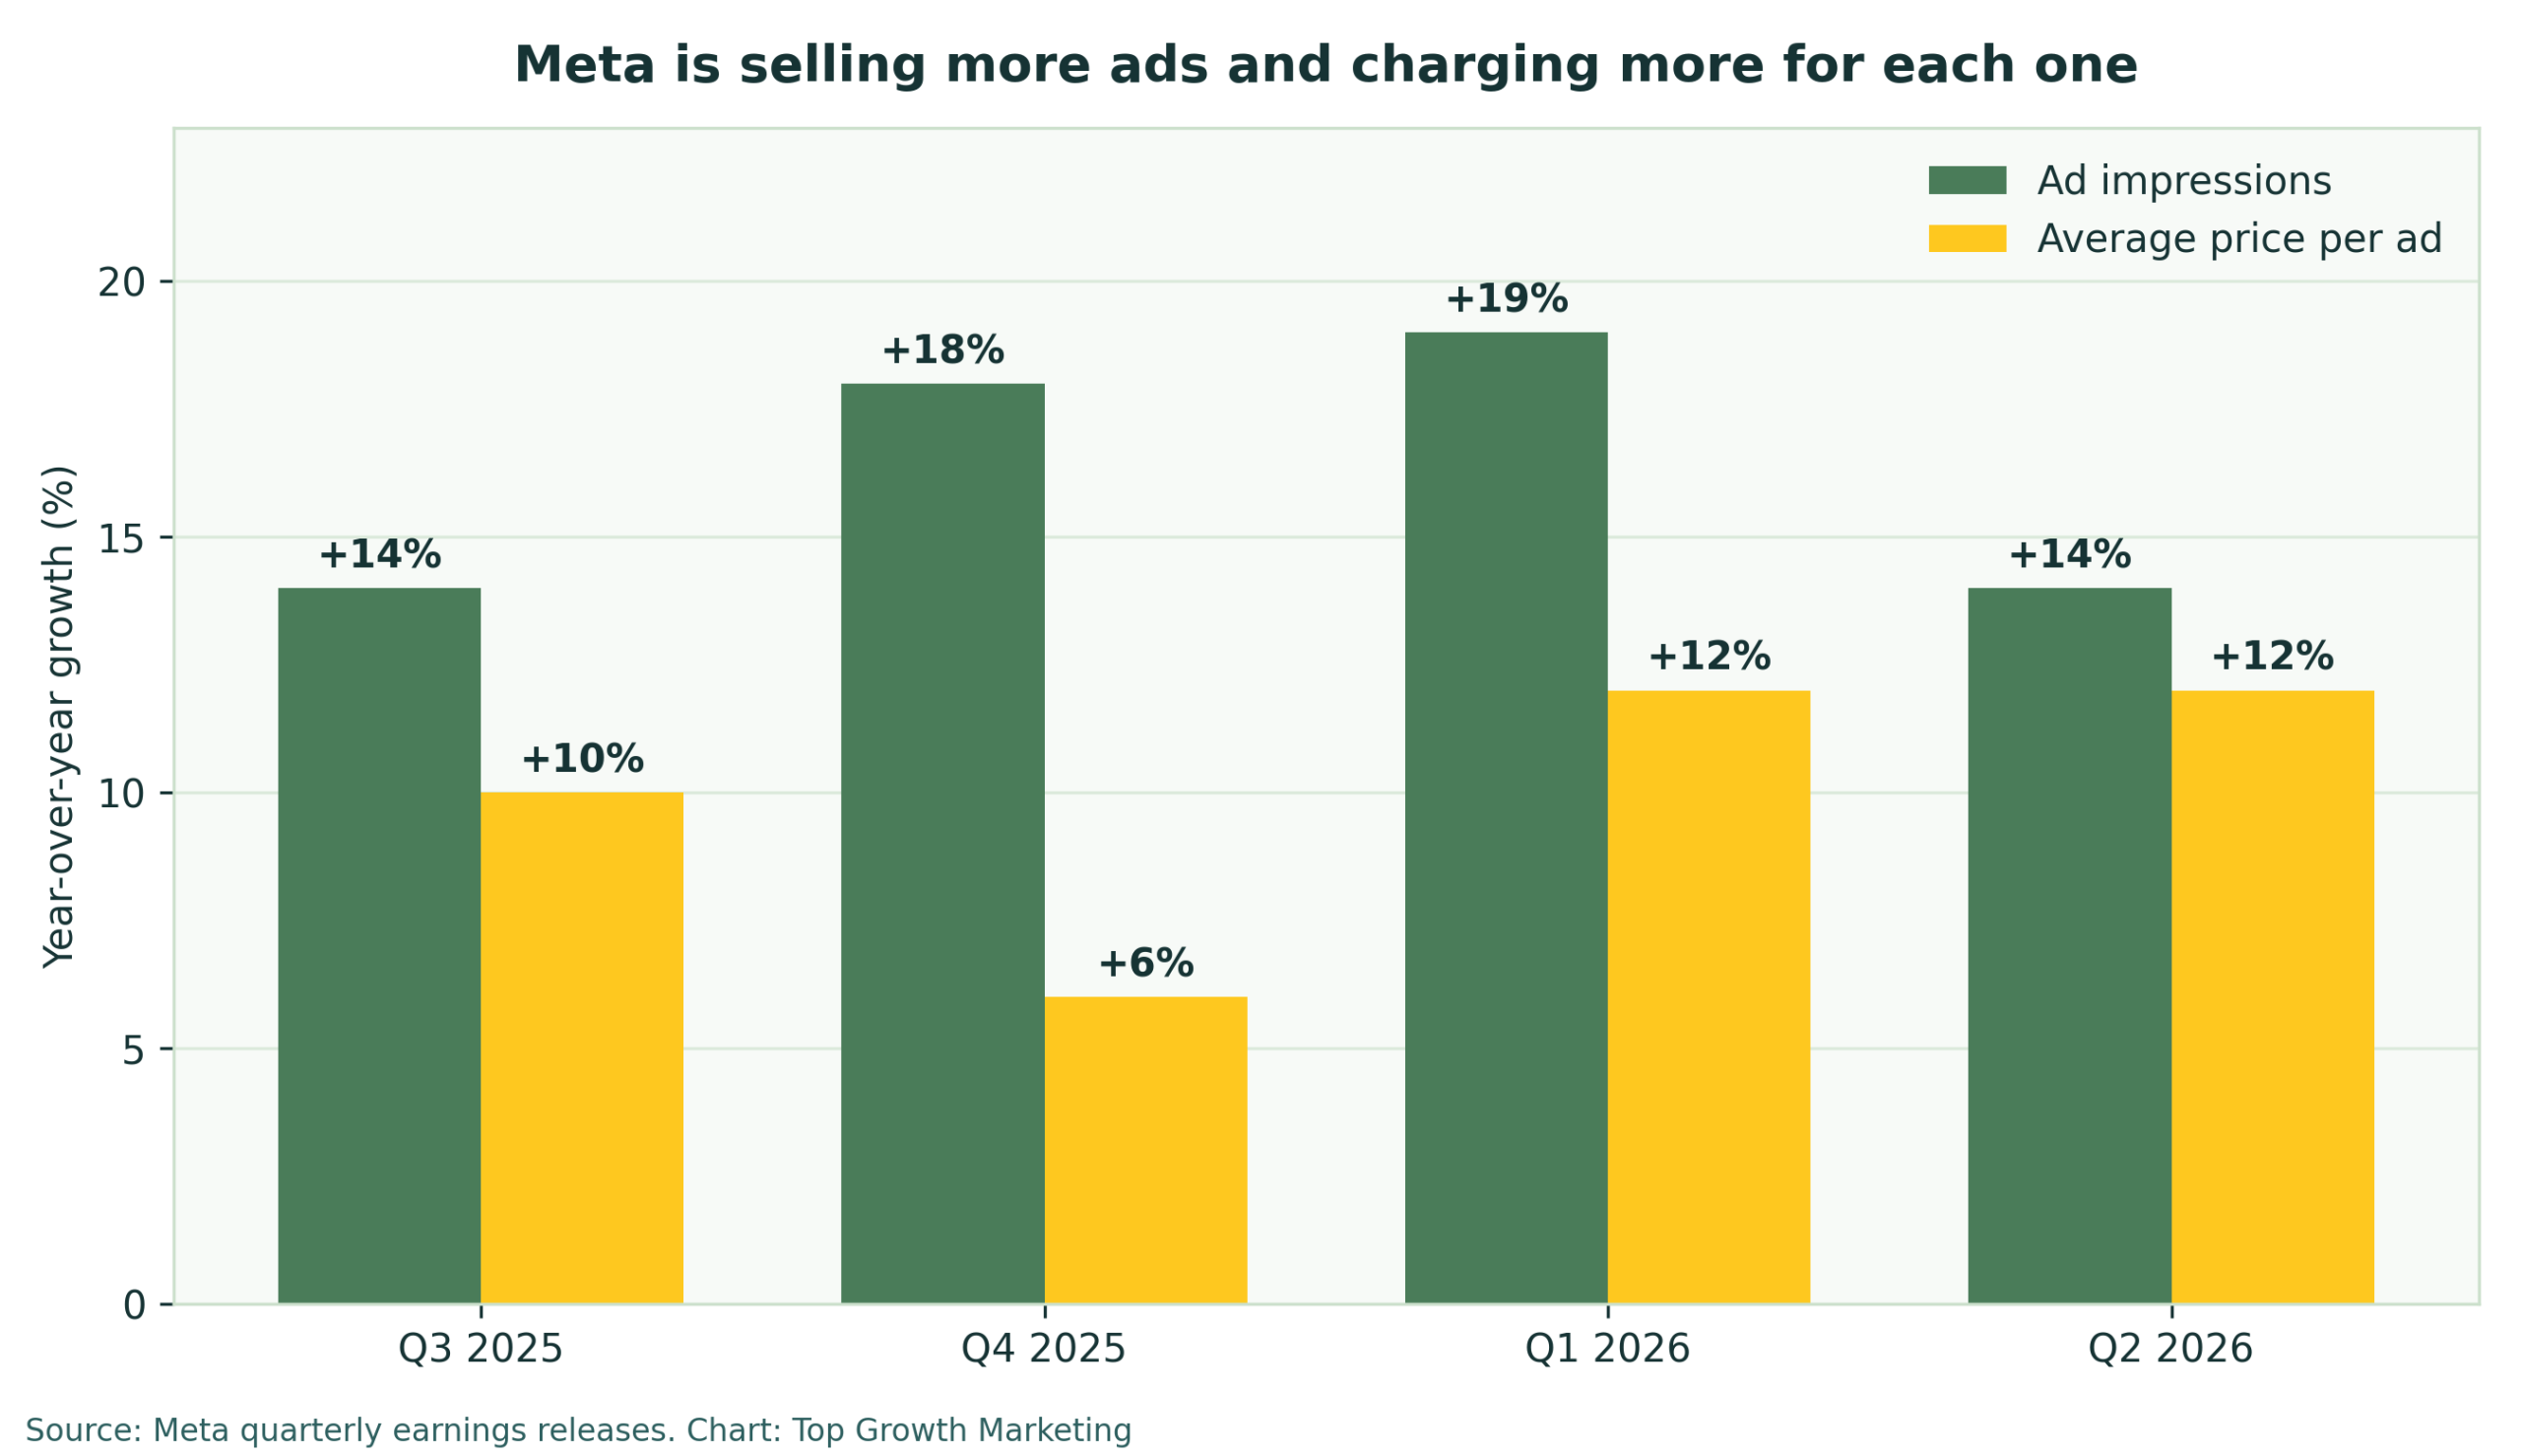
More impressions means more inventory to bid on. Growth was even faster in the two quarters before: 18% in Q4 2025 and 19% in Q1 2026.
11. The average price per ad rose 12%
Price per ad climbed 12% year over year in Q2 2026, the same rate as Q1. Multiply the two growth rates (1.14 × 1.12 = 1.277) and you land close to the 27% rise in ad revenue.
12. Across 2025, impressions rose 12% and prices rose 9%
Those are Meta's full-year figures. Prices have risen in each of the last four quarters, by between 6% and 12%.
13. Q4 2025 had the smallest price increase
Impressions jumped 18% in the holiday quarter while price per ad rose only 6%. Supply grew three times as fast as price that quarter. One platform-wide average says little about your category, which is why we plan holiday budgets from account history and a Facebook ads budget calculator.
What Is the Average CPM for Facebook Ads in 2026?
The median Facebook ads CPM is $13.52, based on 15 DTC ad accounts we tracked from July 2025 to June 2026. Those accounts spent $2.46 million and bought 171 million impressions. The full method is on our Meta ads benchmarks page.
14. The middle half of accounts pay $11.04 to $22.90 CPM
That's the 25th to 75th percentile range. If you're new to the metric, our CPM guide explains how the auction sets it.
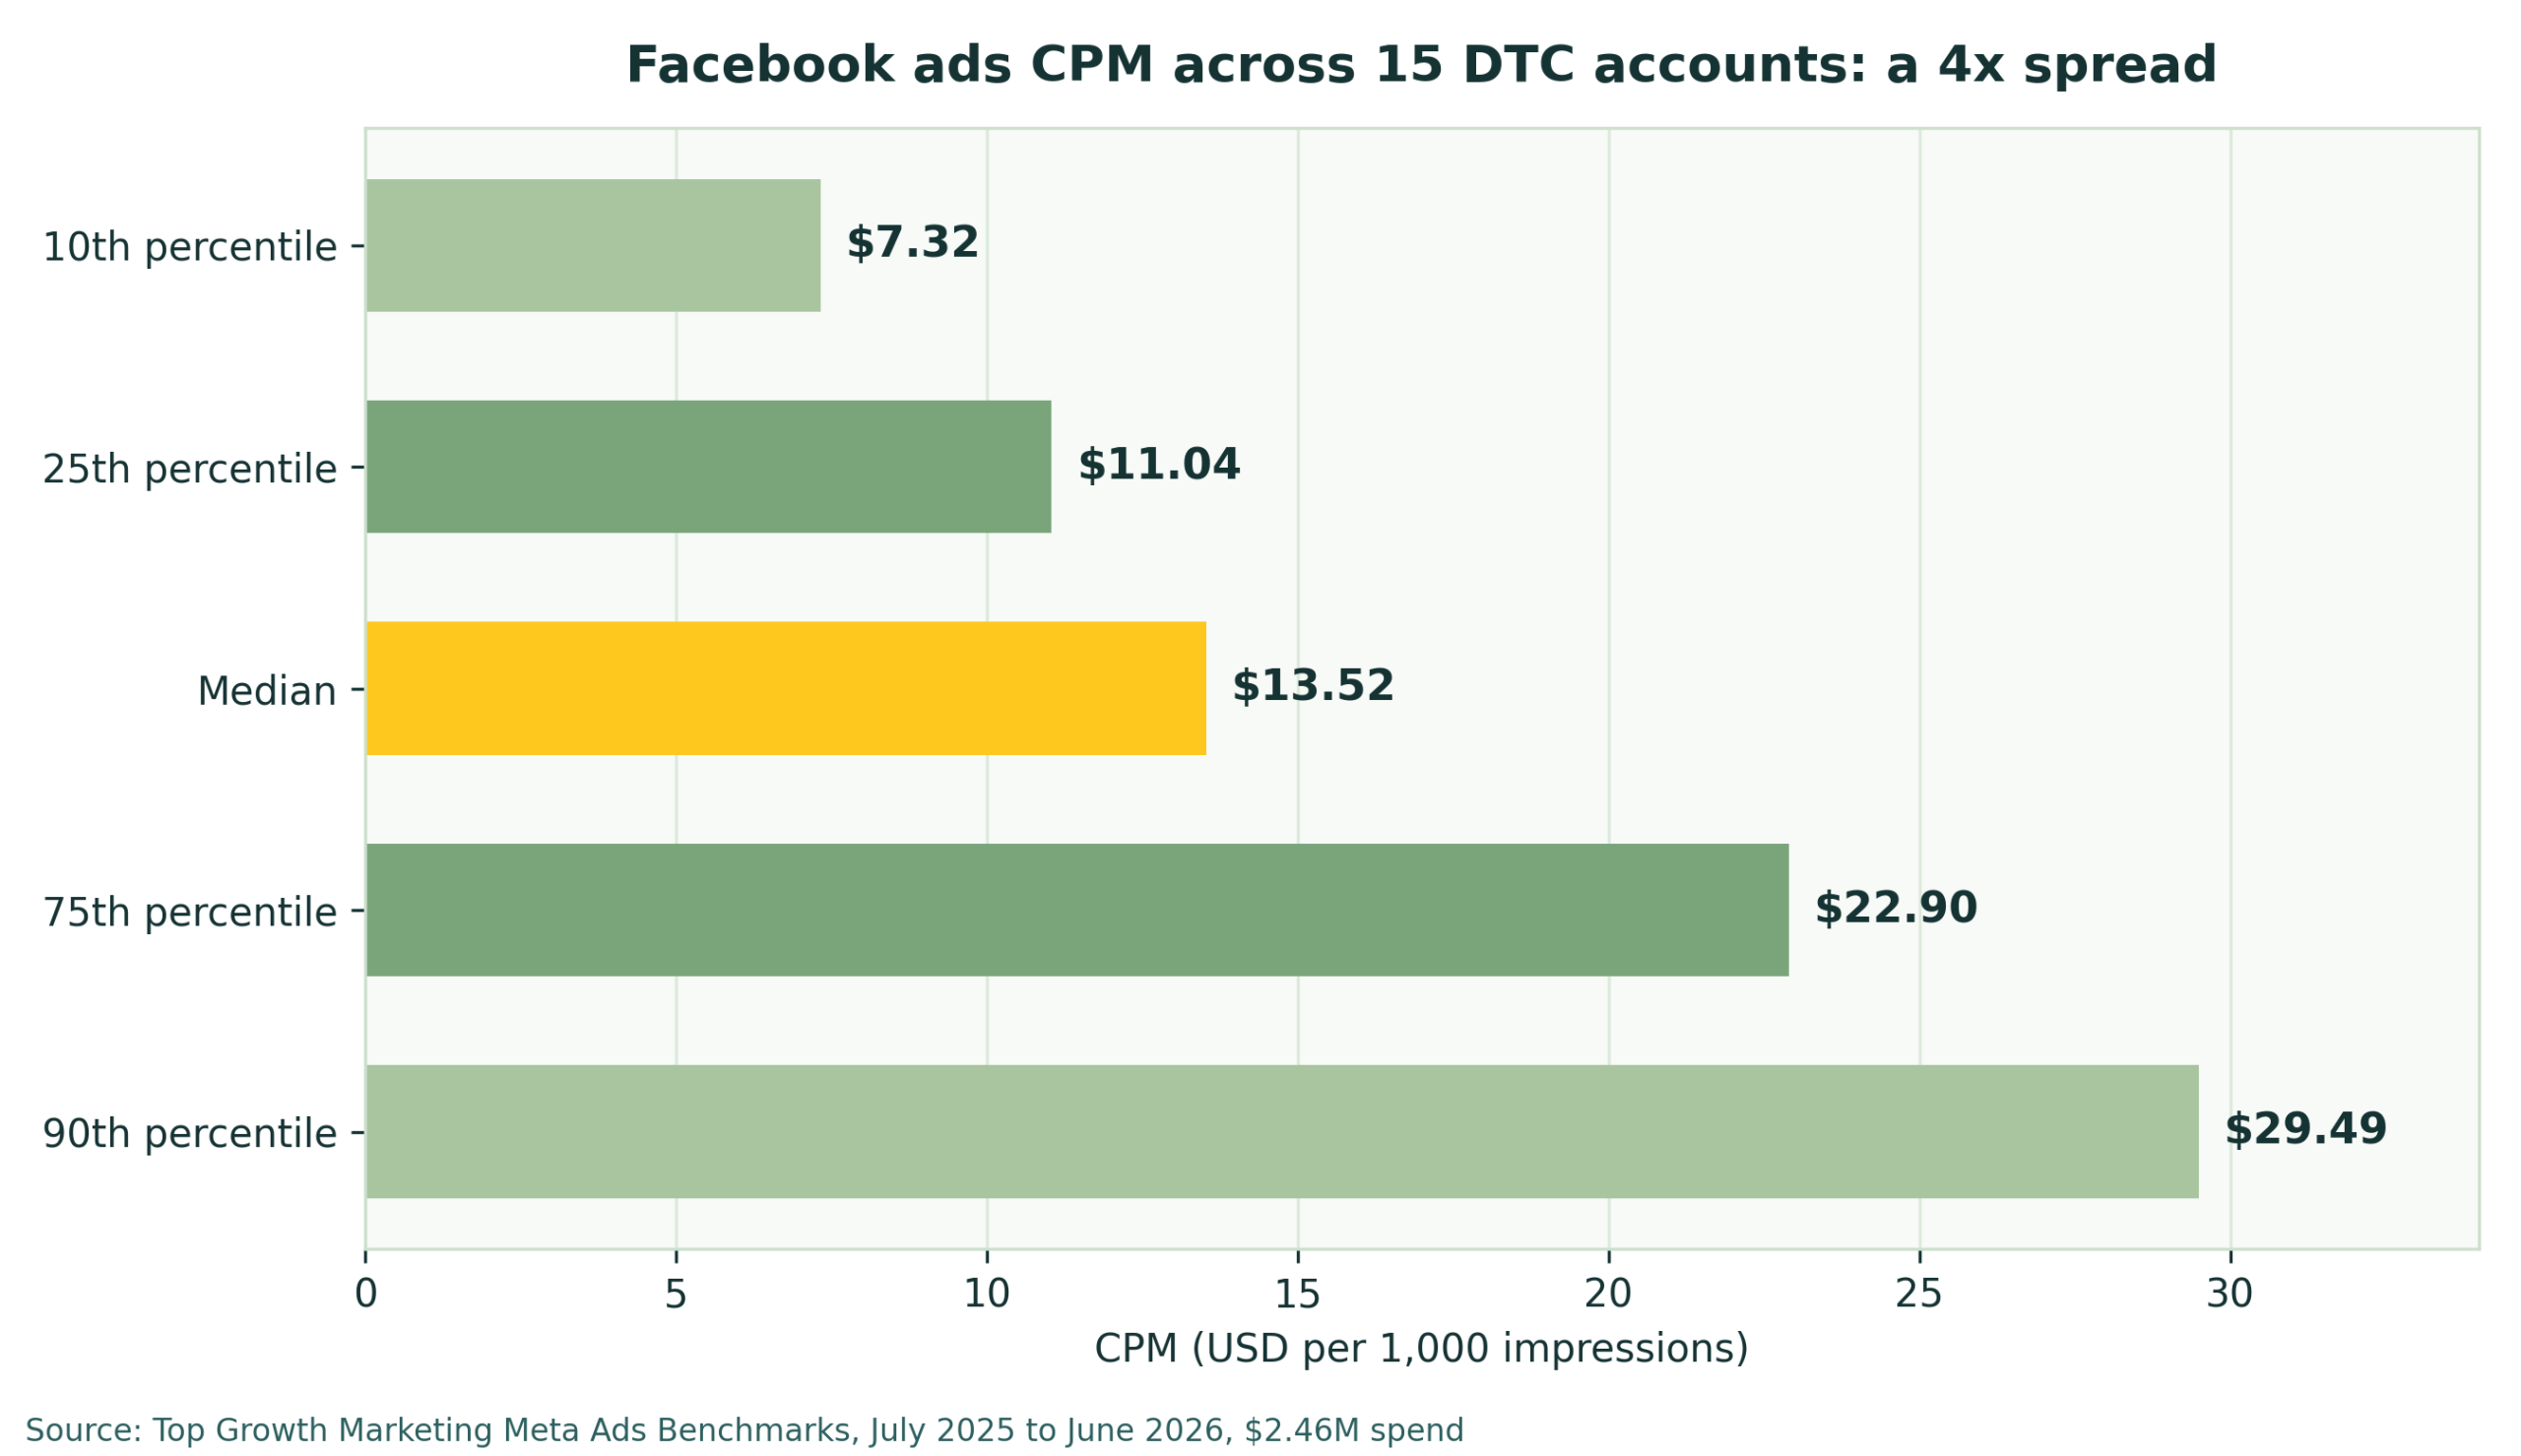
"Across 15 DTC ad accounts, the 90th-percentile CPM was $29.49 and the 10th was $7.32. Same platform, four times the price." — Top Growth Marketing, 2026 Meta Ads Benchmarks
15. Median cost per click is $0.57
The middle half of accounts paid between $0.33 and $1.01 per click.
16. Median click-through rate is 2.68%
The interquartile range is 1.78% to 2.91%. We cover what moves it in what counts as a good CTR.
17. Median purchase ROAS is 2.96
Half of the accounts landed between 2.50 and 5.30. In our experience running these accounts, the spread matters more than the middle: the 10th-percentile account earned a 1.36 ROAS and the 90th earned 17.06.
18. Median cost per purchase is $49.04
Click-to-purchase rate sits at a median of 1.24%. Cost per purchase runs from $16.65 at the 25th percentile to $108.30 at the 75th.
Facebook Ad Benchmarks by Industry
These four come from WordStream’s Facebook ads benchmarks, a 2024 report that WordStream last updated in September 2026. It covers all industries, so expect lower click-through rates than a DTC-only panel.
19. Traffic campaigns average a 1.57% CTR and a $0.77 CPC
That's the all-industry average for campaigns optimized for traffic.
20. Lead campaigns convert at 8.78% and cost $21.98 per lead
Lead campaigns also average a 2.53% click-through rate and a $1.88 cost per click.
21. Real estate has the highest traffic CTR at 2.60%
Finance and insurance sits at the bottom with 0.85%.
22. Legal services pay the most per click on lead campaigns: $8.50
Sports and recreation pays the least, at $1.20. That's a sevenfold gap inside one campaign type.
How to Use These Facebook Ad Stats
- Budget for price increases. Price per ad rose 12% in each of the last two quarters. Flat budgets buy fewer impressions each year.
- Benchmark against a range. Find where your CPM sits between $11.04 and $22.90 before you call it high or low.
- Let the system find the cheap impressions. Supply is growing by double digits, and Advantage+ Shopping campaigns with broad targeting are built to reach across it.
- Reuse your best buyers. Custom audiences built from past purchasers mean you aren't relying on prospecting alone as prices rise.
The TGM Take
Most people read a stats page looking for one number to put in a forecast, usually the average CPM. I think that's the least useful figure here. In our own panel the most expensive accounts pay four times what the cheapest pay, on the same platform, in the same year.
The stat I'd plan around is Meta's price per ad, up 12% two quarters running. Your costs will drift up even if you change nothing. I'd put the effort into creative that earns a higher click-through rate, because that's the input you control.
— Jack Paxton, Founder, Top Growth Marketing
Conclusion
Facebook advertising is still growing on every measure Meta reports. Daily audience is up 3%, ad impressions are up 14% and advertisers are paying 12% more per ad than a year ago.
Use the platform numbers to set expectations and your own account data to set targets. If you'd like a second opinion on where your CPM, CTR and ROAS sit against these ranges, our Facebook ads agency team can walk through the account with you.
Frequently Asked Questions
How many people use Facebook in 2026?
Meta reported 3.60 billion daily active people across Facebook, Instagram, WhatsApp and Messenger in June 2026, up 3% from a year earlier. Meta's earnings releases give no Facebook-only user count. In the US, Pew Research found that 71% of adults use Facebook.
How much money does Facebook make from ads?
Meta earned $59.36 billion in advertising revenue in the second quarter of 2026, which is 97.6% of its total revenue for the quarter. For the full year 2025, Meta's advertising revenue was $196.18 billion, up 22% from 2024.
What is the average CPM for Facebook ads?
The median Facebook ads CPM is $13.52 in Top Growth Marketing's panel of 15 DTC accounts, measured from July 2025 to June 2026. The middle half of those accounts paid between $11.04 and $22.90, so your own account history is a better planning number than any single average.
What is a good CTR for Facebook ads?
A click-through rate above 1.57% beats WordStream's all-industry average for Facebook traffic campaigns. DTC ecommerce accounts tend to run higher: the median CTR in Top Growth Marketing's 15-account panel is 2.68%, with the middle half between 1.78% and 2.91%.
Are Facebook ads getting more expensive?
Yes. Meta's average price per ad rose 12% year over year in both Q1 and Q2 2026, after rising 9% across 2025. Ad impressions grew 14% in Q2 2026 over the same period, so the higher prices come from more advertiser demand in the auction.
Last updated:











0 Comments