Profitable DTC scaling requires understanding five core unit economics metrics: CAC, LTV, gross margin, contribution margin, and payback period. The critical ratio is LTV:CAC — anything below 3:1 on a 12-month basis signals a broken acquisition or retention model. This guide breaks down every metric, the formulas to calculate them, and the benchmarks that separate scaling brands from stalling ones.
Here's a number that should terrify every DTC founder: the average eCommerce brand has an 8.8% net margin. Out of every $75 in revenue, just $6.59 reaches the bottom line.
That's assuming no discounts, no free gifts, and no customer service costs on the order. Throw those in, and you might be losing money on every sale — especially if you're running paid ads without understanding your unit economics.
Unit economics is the math of a single customer transaction: how much revenue it generates, what it costs to fulfill, what you paid to acquire that customer, and what's left over. Get these numbers right and scaling becomes a multiplication exercise. Get them wrong and every dollar of ad spend accelerates your losses.
After working with hundreds of DTC brands at Top Growth Marketing, we've found that the difference between brands that scale to $10M and brands that stall at $500K almost always comes down to one thing: how well they understand and optimize their unit economics.
This guide breaks down every number you need to know — with visual frameworks, real benchmarks, and free calculators you can use today.
"Revenue is a vanity metric. Unit economics is the truth. The brands that scale profitably obsess over per-order math, not top-line dashboards."
What unit economics metrics matter most for DTC brands?
Five core metrics: CAC, LTV, gross margin, contribution margin, and payback period. The critical ratio is LTV:CAC — anything below 3:1 on a 12-month basis signals a broken acquisition or retention model. Contribution margin is the most-ignored metric and the one that determines whether you can actually scale profitably.
What's a healthy LTV:CAC ratio for an eCommerce brand?
3:1 minimum at 12 months, 4:1+ at 24 months. Below 3:1 you're fighting math — every new customer locks in losses. Brands at 5:1+ can typically afford to scale aggressively because each customer pays back fast enough to fund the next acquisition cycle.
What is a good break-even ROAS for DTC?
Break-even ROAS = 1 ÷ Gross Margin %. A brand with 60% gross margin breaks even at 1.67 ROAS; 50% margin breaks even at 2.0; 40% at 2.5. Most DTC brands need to operate 1.3–1.5x above break-even to cover overhead and still profit — so a 60%-margin brand should target 2.2–2.5 ROAS.
The DTC Unit Economics Stack: What You Actually Need to Track
Most DTC founders track revenue and ROAS. That's it. But profitable scaling requires a full stack of interconnected metrics — each one feeding into the next. Miss one layer and the whole model breaks.
Here's the complete unit economics stack, from the ground up:
Layer 1: Product-Level Economics
This is your foundation. Before you spend anything on marketing, every product needs to pass this test:
| Metric | Formula | Healthy DTC Benchmark |
|---|---|---|
| COGS | Raw materials + manufacturing + packaging | < 30% of revenue |
| Gross Margin | (Revenue - COGS) / Revenue | > 65% |
| Shipping Cost | Per-order fulfillment + carrier fees | 8-12% of revenue |
| Processing Fees | Payment gateway + platform fees | 3-4% of revenue |
| Returns Reserve | Return rate × cost per return | 3-8% of revenue |
| Net Margin (pre-ad) | Revenue minus ALL variable costs above | > 40% |
If your net margin before ad spend is below 30%, paid advertising will be an uphill battle. You need to fix product costs, pricing, or fulfillment before you scale.
"Don't scale a leaky bucket. If your unit economics don't work at $1K in ad spend, they won't magically work at $100K."
Run your numbers right now with our free eCommerce Performance Calculator — a 52-point profitability audit that reveals your true acquisition cost, profit per customer, and exactly where your margins are leaking. It works with Shopify, GA4, and Triple Whale data.
Contribution Margin: The #1 Metric Most DTC Brands Ignore
ROAS tells you how much revenue your ads generate. Contribution margin tells you how much profit each order actually produces. In 2026, this is the metric that separates brands that scale from brands that scale into bankruptcy.
Contribution Margin = Revenue - COGS - Shipping - Processing - Fulfillment - Ad Spend
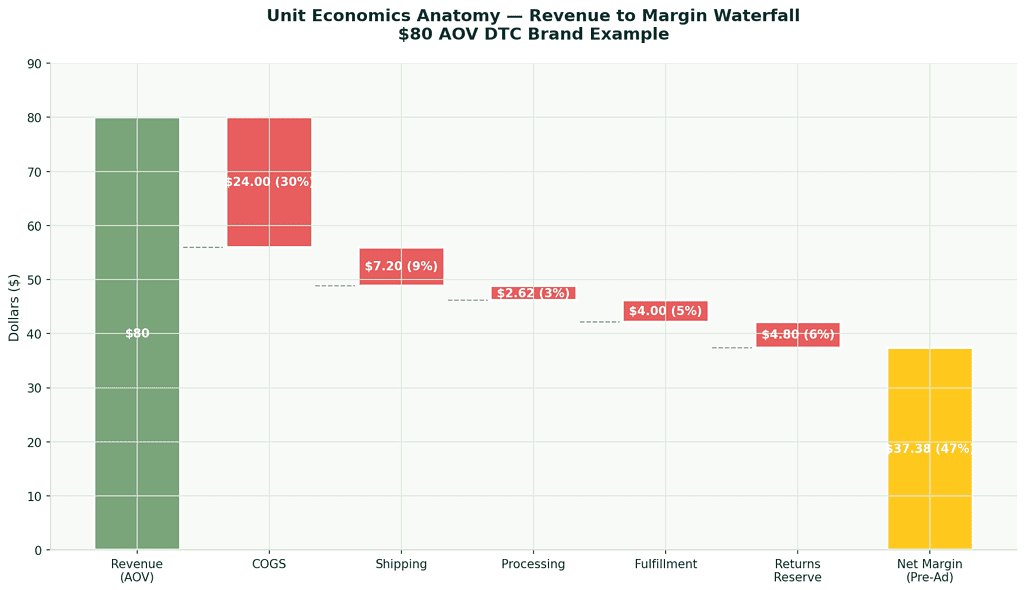
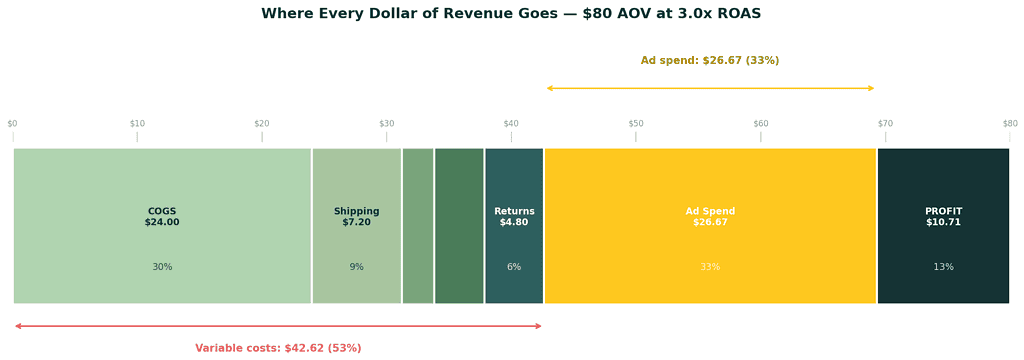
Let's run the math for a typical DTC brand at $80 AOV running at 3.0x ROAS:
- Revenue: $80.00
- COGS: -$24.00 (30%)
- Shipping: -$7.20 (9%)
- Payment processing: -$2.62 (3.3%)
- Fulfillment: -$4.00 (5%)
- Ad spend (at 3.0x): -$26.67
- Contribution margin: $15.51 (19.4%)
That means at a "healthy" 3.0x ROAS, this brand keeps $15.51 per order. If they need to cover $50K in monthly fixed costs (team, rent, software), they need 3,225 orders per month just to break even at the business level.
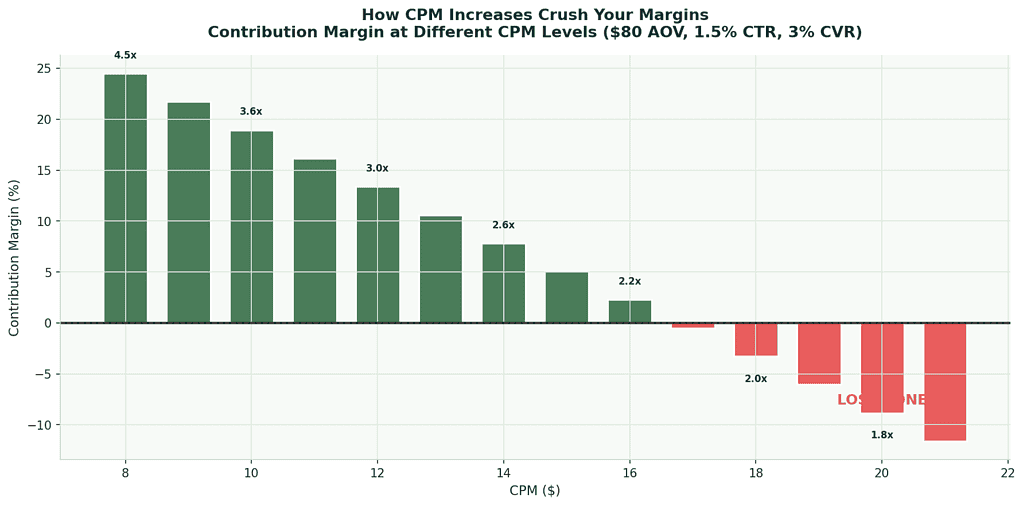
Now watch what happens at different ROAS levels:
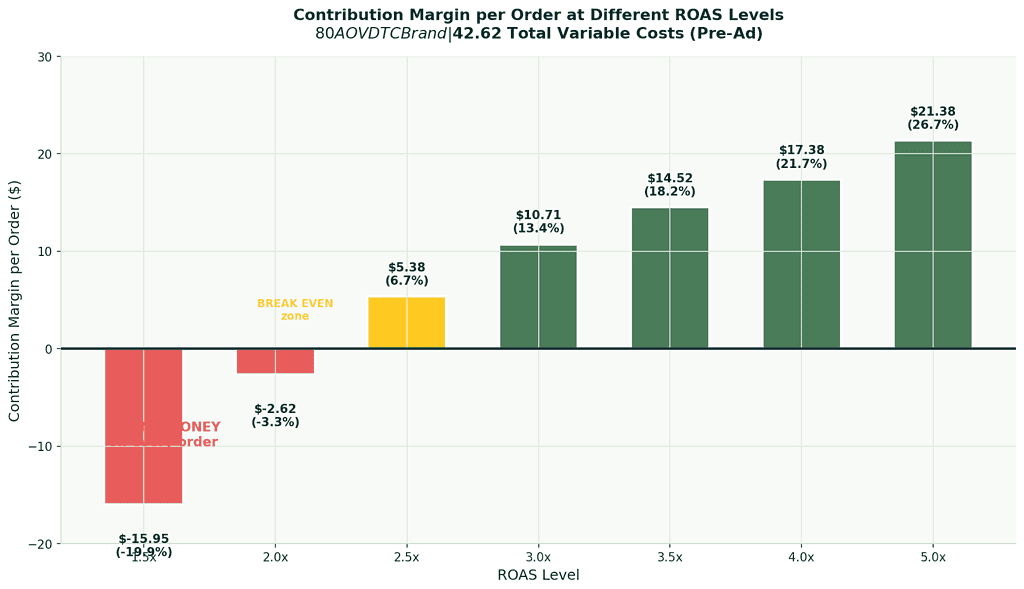
This is why ROAS alone is misleading. A 2.0x ROAS can be profitable for a high-margin beauty brand (55% net margin = 1.82x break-even ROAS) but devastating for a food brand (20% net margin = 5.0x break-even ROAS).
Use our Contribution Margin Calculator to model your exact per-order profit at any ROAS level.
Break-Even ROAS: Your Most Important Number
Break-even ROAS is the minimum return on ad spend you need to cover all costs. Below this number, you lose money on every order. Above it, you profit.
Break-Even ROAS = 1 / Net Margin (pre-ad spend)
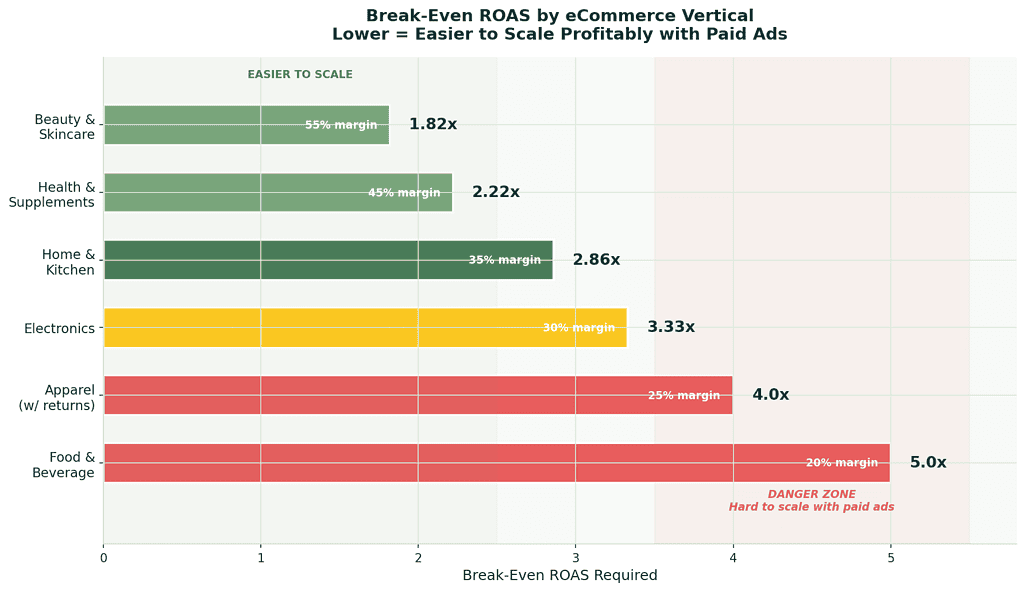
| Net Margin (Pre-Ad) | Break-Even ROAS | Example Vertical |
|---|---|---|
| 55% | 1.82x | Beauty & skincare |
| 45% | 2.22x | Health & supplements |
| 35% | 2.86x | Home & kitchen |
| 25% | 4.00x | Apparel (with returns) |
| 20% | 5.00x | Food & beverage |
The most common mistake we see: brands using gross margin instead of net margin in this formula. A brand with 60% gross margin thinks their break-even ROAS is 1.67x. But when shipping, processing, fulfillment, and returns are factored in, their true net margin might be 30% — making their actual break-even 3.33x. That's nearly double.
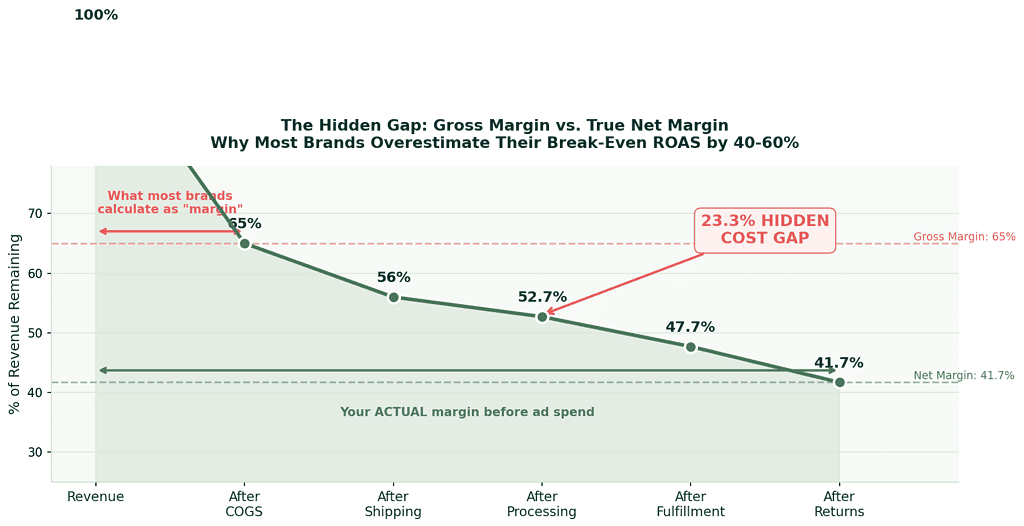
That 23.3% gap between gross margin and true net margin is where most DTC brands miscalculate. Every hidden cost — shipping, processing, fulfillment, returns — erodes your margin and pushes your break-even ROAS higher than you think.
Calculate yours instantly with our ROAS Calculator.
The LTV Multiplier: When Break-Even on Order 1 Is a Winning Strategy
Here's where sophisticated DTC brands gain their edge: they don't optimize unit economics on the first order alone. They calculate Customer Lifetime Value (LTV) and use it to justify aggressive acquisition.
If your average customer buys 3 times over 12 months at $80 AOV, their LTV is $240 in revenue. Even if your first-order ROAS is 1.8x (below break-even), the customer generates $160 more in revenue with zero additional ad spend.
LTV-Adjusted Break-Even ROAS = First-Order Break-Even / Average Purchase Frequency
| Vertical | Avg. Purchases (12 mo) | First-Order BE ROAS | LTV-Adjusted BE ROAS |
|---|---|---|---|
| Beauty & Skincare | 3.5x | 1.82x | 0.52x |
| Supplements | 4.0x | 2.22x | 0.56x |
| Food & Beverage | 5.0x | 5.00x | 1.00x |
| Apparel | 1.8x | 4.00x | 2.22x |
| Home & Kitchen | 1.2x | 2.86x | 2.38x |
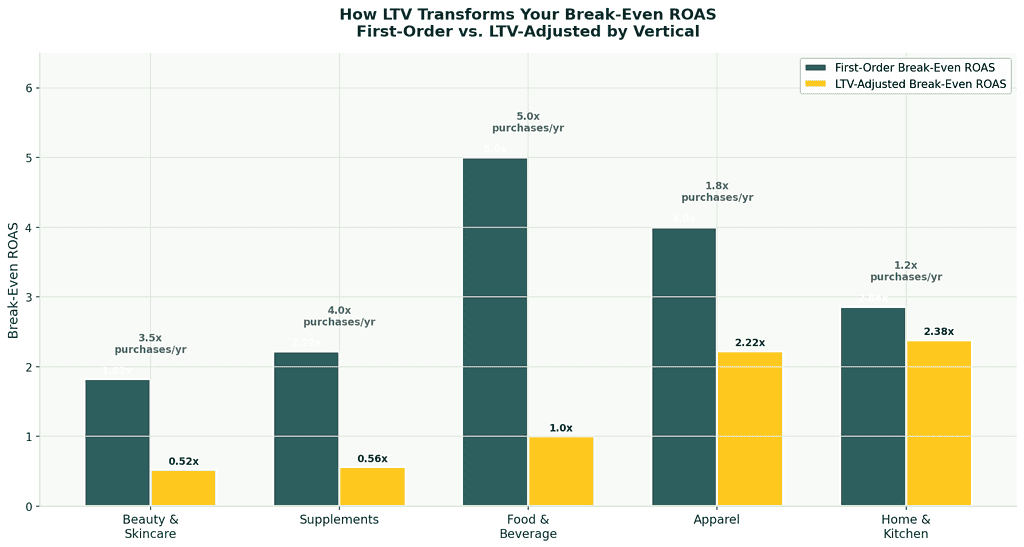
Notice the gap: beauty and supplements can acquire customers at near break-even (or even a loss) on order 1 and still be wildly profitable. Apparel and home goods need to be profitable on every single order because repeat rates are low.
"The DTC brands that scale fastest aren't the ones with the best ROAS. They're the ones who understand their LTV well enough to acquire customers everyone else can't afford."
To audit your full customer journey — including repeat purchase rate, LTV, and true CPA — run our free 52-Point Profitability Audit. It benchmarks your numbers against hundreds of eCommerce brands so you know exactly where you stand.
How CPM Changes Destroy (or Create) Profit
Your unit economics aren't static. They shift every time your CPMs change — and in 2026, CPMs are moving fast across every platform.
Here's the chain reaction:
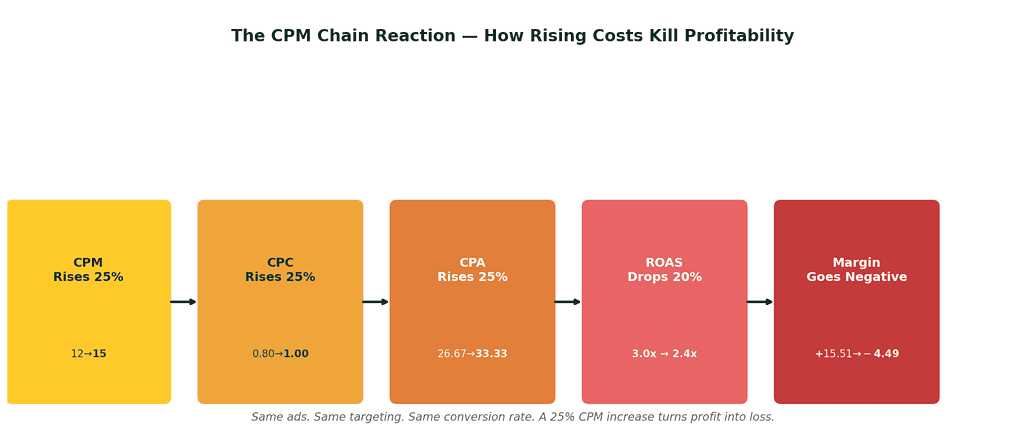
A 25% CPM increase doesn't just cost 25% more — it can push a profitable campaign below break-even entirely. Same ads, same targeting, same conversion rate.
The levers to fight rising CPMs:
- Improve CTR — better hooks and UGC-style creative can lower your effective CPC even as CPMs rise
- Improve CVR — landing page optimization is the most underrated lever in paid media
- Increase AOV — bundles and upsells raise revenue per visitor without additional ad spend
- Diversify channels — TikTok CPMs remain 30-40% below Meta for most audiences
Monitor your CPMs weekly with our CPM Calculator and track daily spend pacing with our Ad Spend & Pacing Calculator.
The Creative Economics Equation
In 2026, creative is the #1 lever for scaling paid ads. Not audience targeting. Not bid strategy. Creative. And it has its own unit economics.
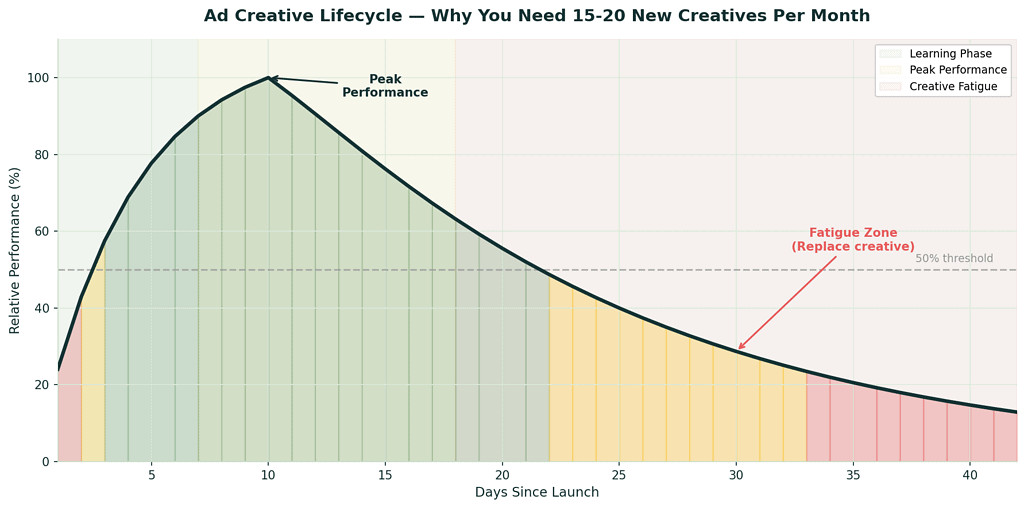
The average Meta ad creative peaks within 7-10 days and hits fatigue by week 3. Brands scaling past $100K/month need 15-20 new creatives per month just to maintain performance.
| Creative Type | Avg. CPA vs. Baseline | Production Cost | ROI per Creative |
|---|---|---|---|
| UGC Video Testimonials | 40-50% lower CPA | $50-200 | Highest |
| Founder Story Videos | 30% higher CTR | $0 (DIY) | Excellent |
| Product Demo / How-To | Highest CVR | $100-300 | High |
| Static Carousel (Benefits) | Baseline CPA | $20-50 | Good for retargeting |
"Creative volume beats creative budget. A $50 UGC video frequently outperforms a $5,000 brand shoot."
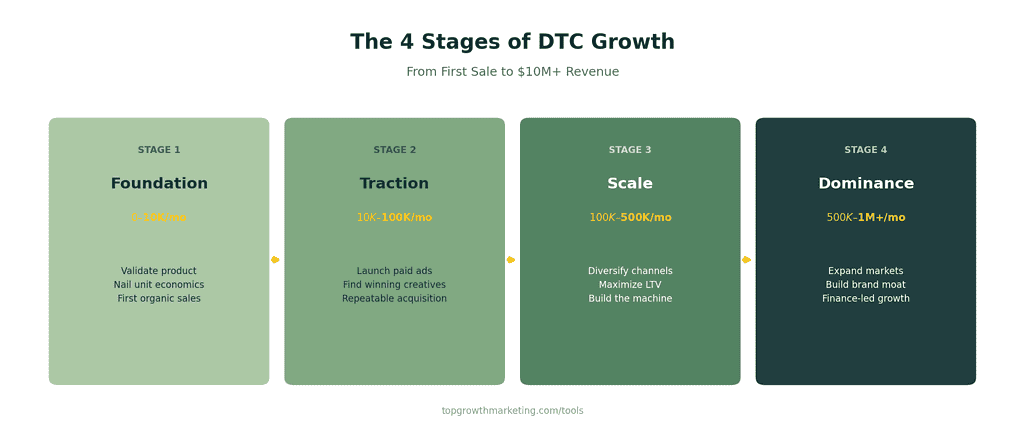
Budget Allocation by Growth Stage
Your unit economics determine not just whether you can scale — but how you should allocate every dollar.
Stage 1: Foundation ($0 - $10K/month)
- 100% organic + referrals — prove the product sells before adding ad spend
- Focus: validate unit economics, collect reviews, build email list
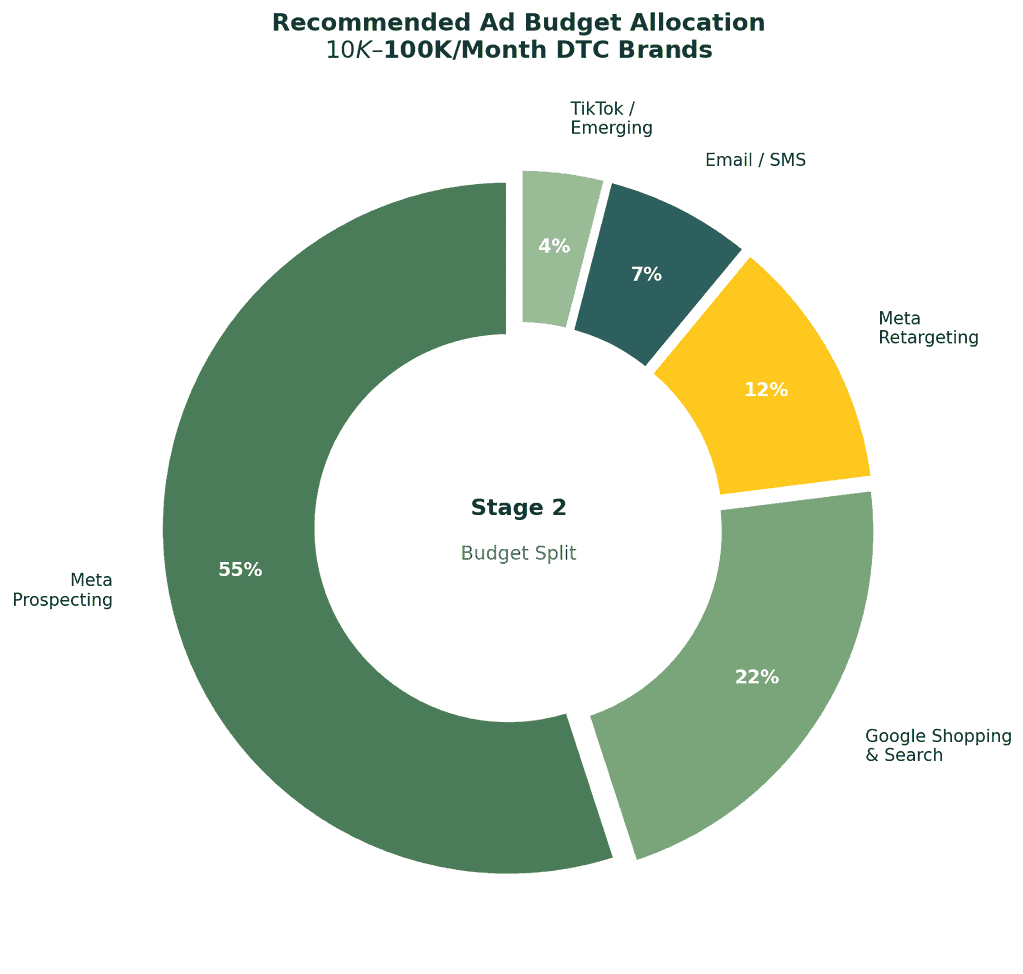
Stage 2: Traction ($10K - $100K/month)
- Meta Prospecting: 50-60%
- Meta Retargeting: 10-15%
- Google Shopping / Search: 20-25%
- Email / SMS: 5-10%
- Use our Facebook Ads Budget Calculator to set your exact daily/monthly budgets
Stage 3: Scale ($100K - $500K/month)
- Diversify: no single channel > 45% of spend
- Add TikTok, expand Google, invest heavily in email/SMS retention
- Shift from ROAS-only to contribution margin per order as your north star
Stage 4: Dominance ($500K+/month)
- Finance-led growth: start with margin targets, back into ad budgets
- International expansion, wholesale channels, product line extension
- Track blended MER (Marketing Efficiency Ratio) across all channels
The ROAS Decay Curve: Why Your Best Days Are Behind You (And That's OK)
Here's the uncomfortable truth: as you increase ad spend, ROAS almost always declines. This isn't failure — it's physics.
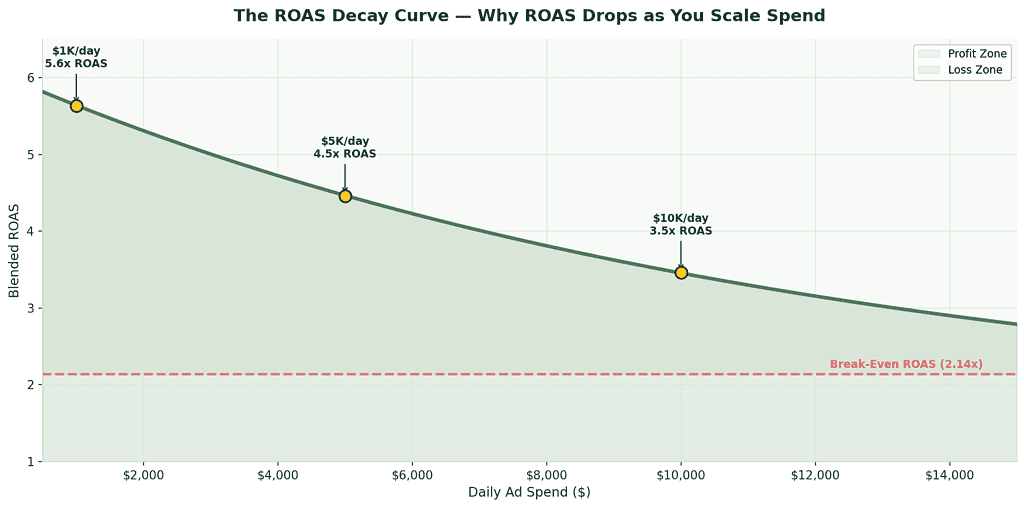
At $1K/day, you're buying the cheapest, highest-intent clicks. At $5K/day, you're reaching broader audiences. At $10K/day, you're paying for people who need 3-5 touchpoints before converting.
The solution isn't chasing a higher ROAS — it's understanding that total contribution margin dollars matter more than ROAS percentage. A campaign running at 2.5x ROAS spending $10K/day generates more profit than a 5.0x ROAS campaign spending $1K/day (assuming margins support it).
This is why unit economics is everything. Without knowing your exact break-even ROAS, you can't make this trade-off intelligently.
The Complete DTC Metrics Dashboard
Different metrics matter at different stages. Here's the master framework — what to obsess over at each level:
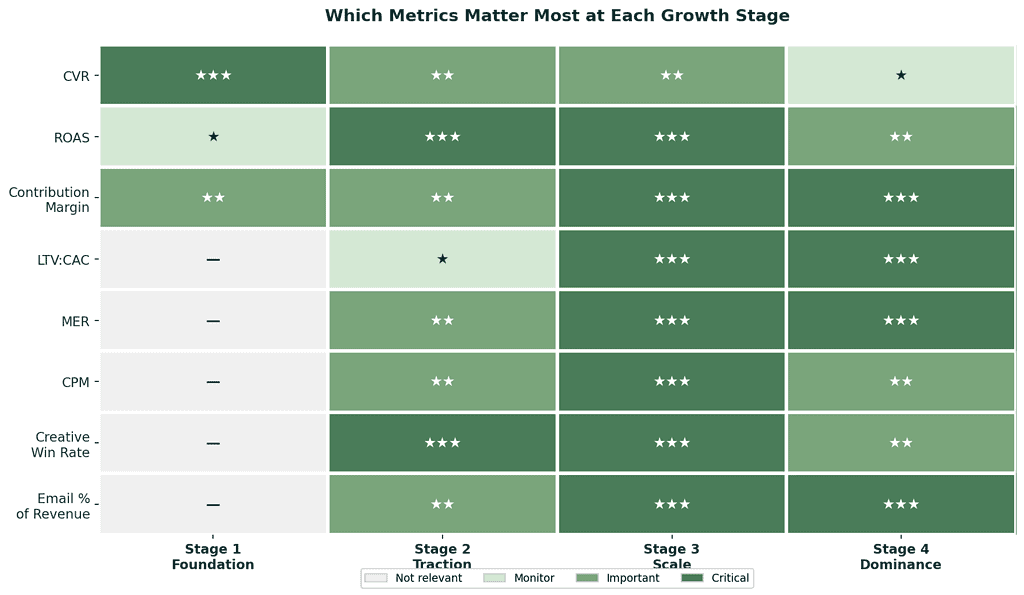
| Metric | Stage 1 | Stage 2 | Stage 3 | Stage 4 |
|---|---|---|---|---|
| CVR | ★★★ | ★★ | ★★ | ★ |
| ROAS | ★ | ★★★ | ★★★ | ★★ |
| Contribution Margin | ★★ | ★★ | ★★★ | ★★★ |
| LTV:CAC | — | ★ | ★★★ | ★★★ |
| MER | — | ★★ | ★★★ | ★★★ |
| CPM | — | ★★ | ★★★ | ★★ |
| Creative Win Rate | — | ★★★ | ★★★ | ★★ |
| Email % of Revenue | — | ★★ | ★★★ | ★★★ |
"What gets measured gets managed. But at different stages, different metrics deserve your obsessive attention."
Your Free DTC Unit Economics Toolkit
We built these tools specifically for DTC brands — no signup, no email gate. They're the same calculators we use with our clients to model unit economics at every growth stage:
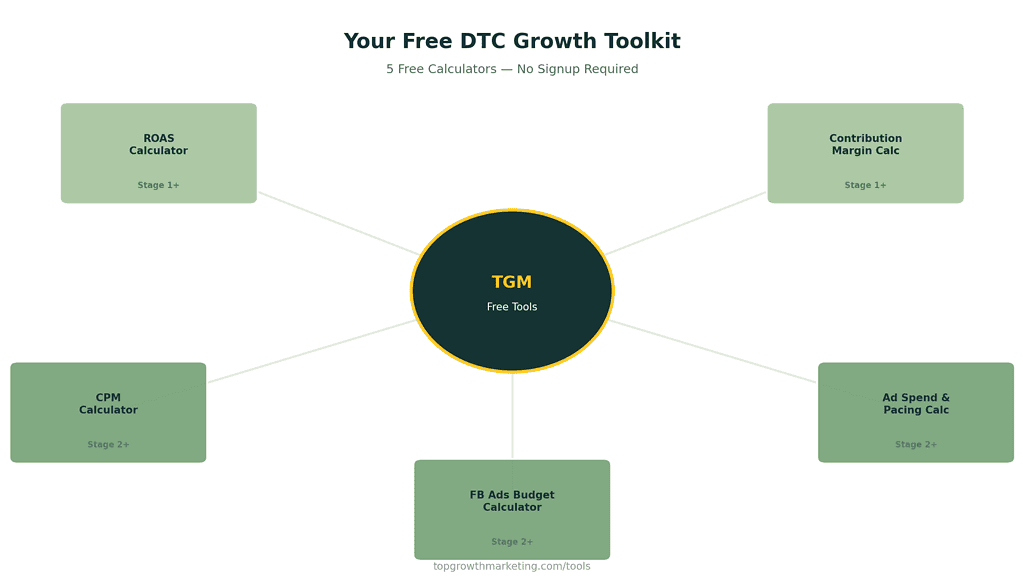
| Tool | What It Does | When You Need It |
|---|---|---|
| eCommerce Performance Calculator | 52-point profitability audit with benchmarks — reveals true CPA, profit per customer, LTV, repeat rate | Every brand, every stage (start here) |
| ROAS Calculator | Calculate break-even and target ROAS from your real costs | Stage 1+ (before spending on ads) |
| Contribution Margin Calculator | See actual per-order profit after ALL variable costs | Stage 1+ (every pricing decision) |
| CPM Calculator | Model how CPM changes impact campaign efficiency | Stage 2+ (weekly monitoring) |
| Facebook Ads Budget Calculator | Set budgets based on revenue targets and ROAS | Stage 2+ (monthly budget planning) |
| Ad Spend & Pacing Calculator | Track daily spend against monthly budget | Stage 2+ (daily pacing checks) |
| All Free Tools | Browse the complete suite of 18+ free eCommerce calculators | Anytime |
Every DTC brand that reaches $10M+ in revenue shares one trait: they know their unit economics cold. Not approximately. Not "we think our margins are around 40%."
They know the exact contribution margin per order, the break-even ROAS by channel, the LTV by cohort, and the CPM thresholds that flip campaigns from profitable to unprofitable.
Here's your action plan:
- Audit your numbers today — run the free 52-Point Profitability Audit to see exactly where you stand vs. industry benchmarks
- Calculate your break-even ROAS using our ROAS Calculator
- Understand your true contribution margin with our Contribution Margin Calculator
- Model your ad budget based on real targets using the Budget Calculator
- Track pacing daily with the Ad Spend & Pacing Calculator


0 Comments